Open Data Interpreter: Talk to your data
Suvansh Sanjeev • 2023-05-23
Data has stories to tell. We've created a tool that lets it speak.
Note: Use a hosted instance of Open Data Interpreter here, or visit the codebase and run your own here.
Introducing our latest project - Open Data Interpreter (OpenDI), an open-source chatbot designed to provide users with an engaging, interactive interface to chat with and explore their own data.
Following our successful release of Blitz, a chatbot providing a user-friendly chat interface over football statistics, we wanted to extend this capability to a wider array of data sources. We were inspired by OpenAI’s Code Interpreter but saw an opportunity to create a tool that was open source and widely accessible. This led us to create Open Data Interpreter.
With OpenDI, users can interact with their CSV files using natural language queries. Just upload your CSV file, and start the conversation! You can generate statistics, tables, and graphs using simple conversational prompts. Want to know the average of a particular column or see a pie chart of categories? Just ask!
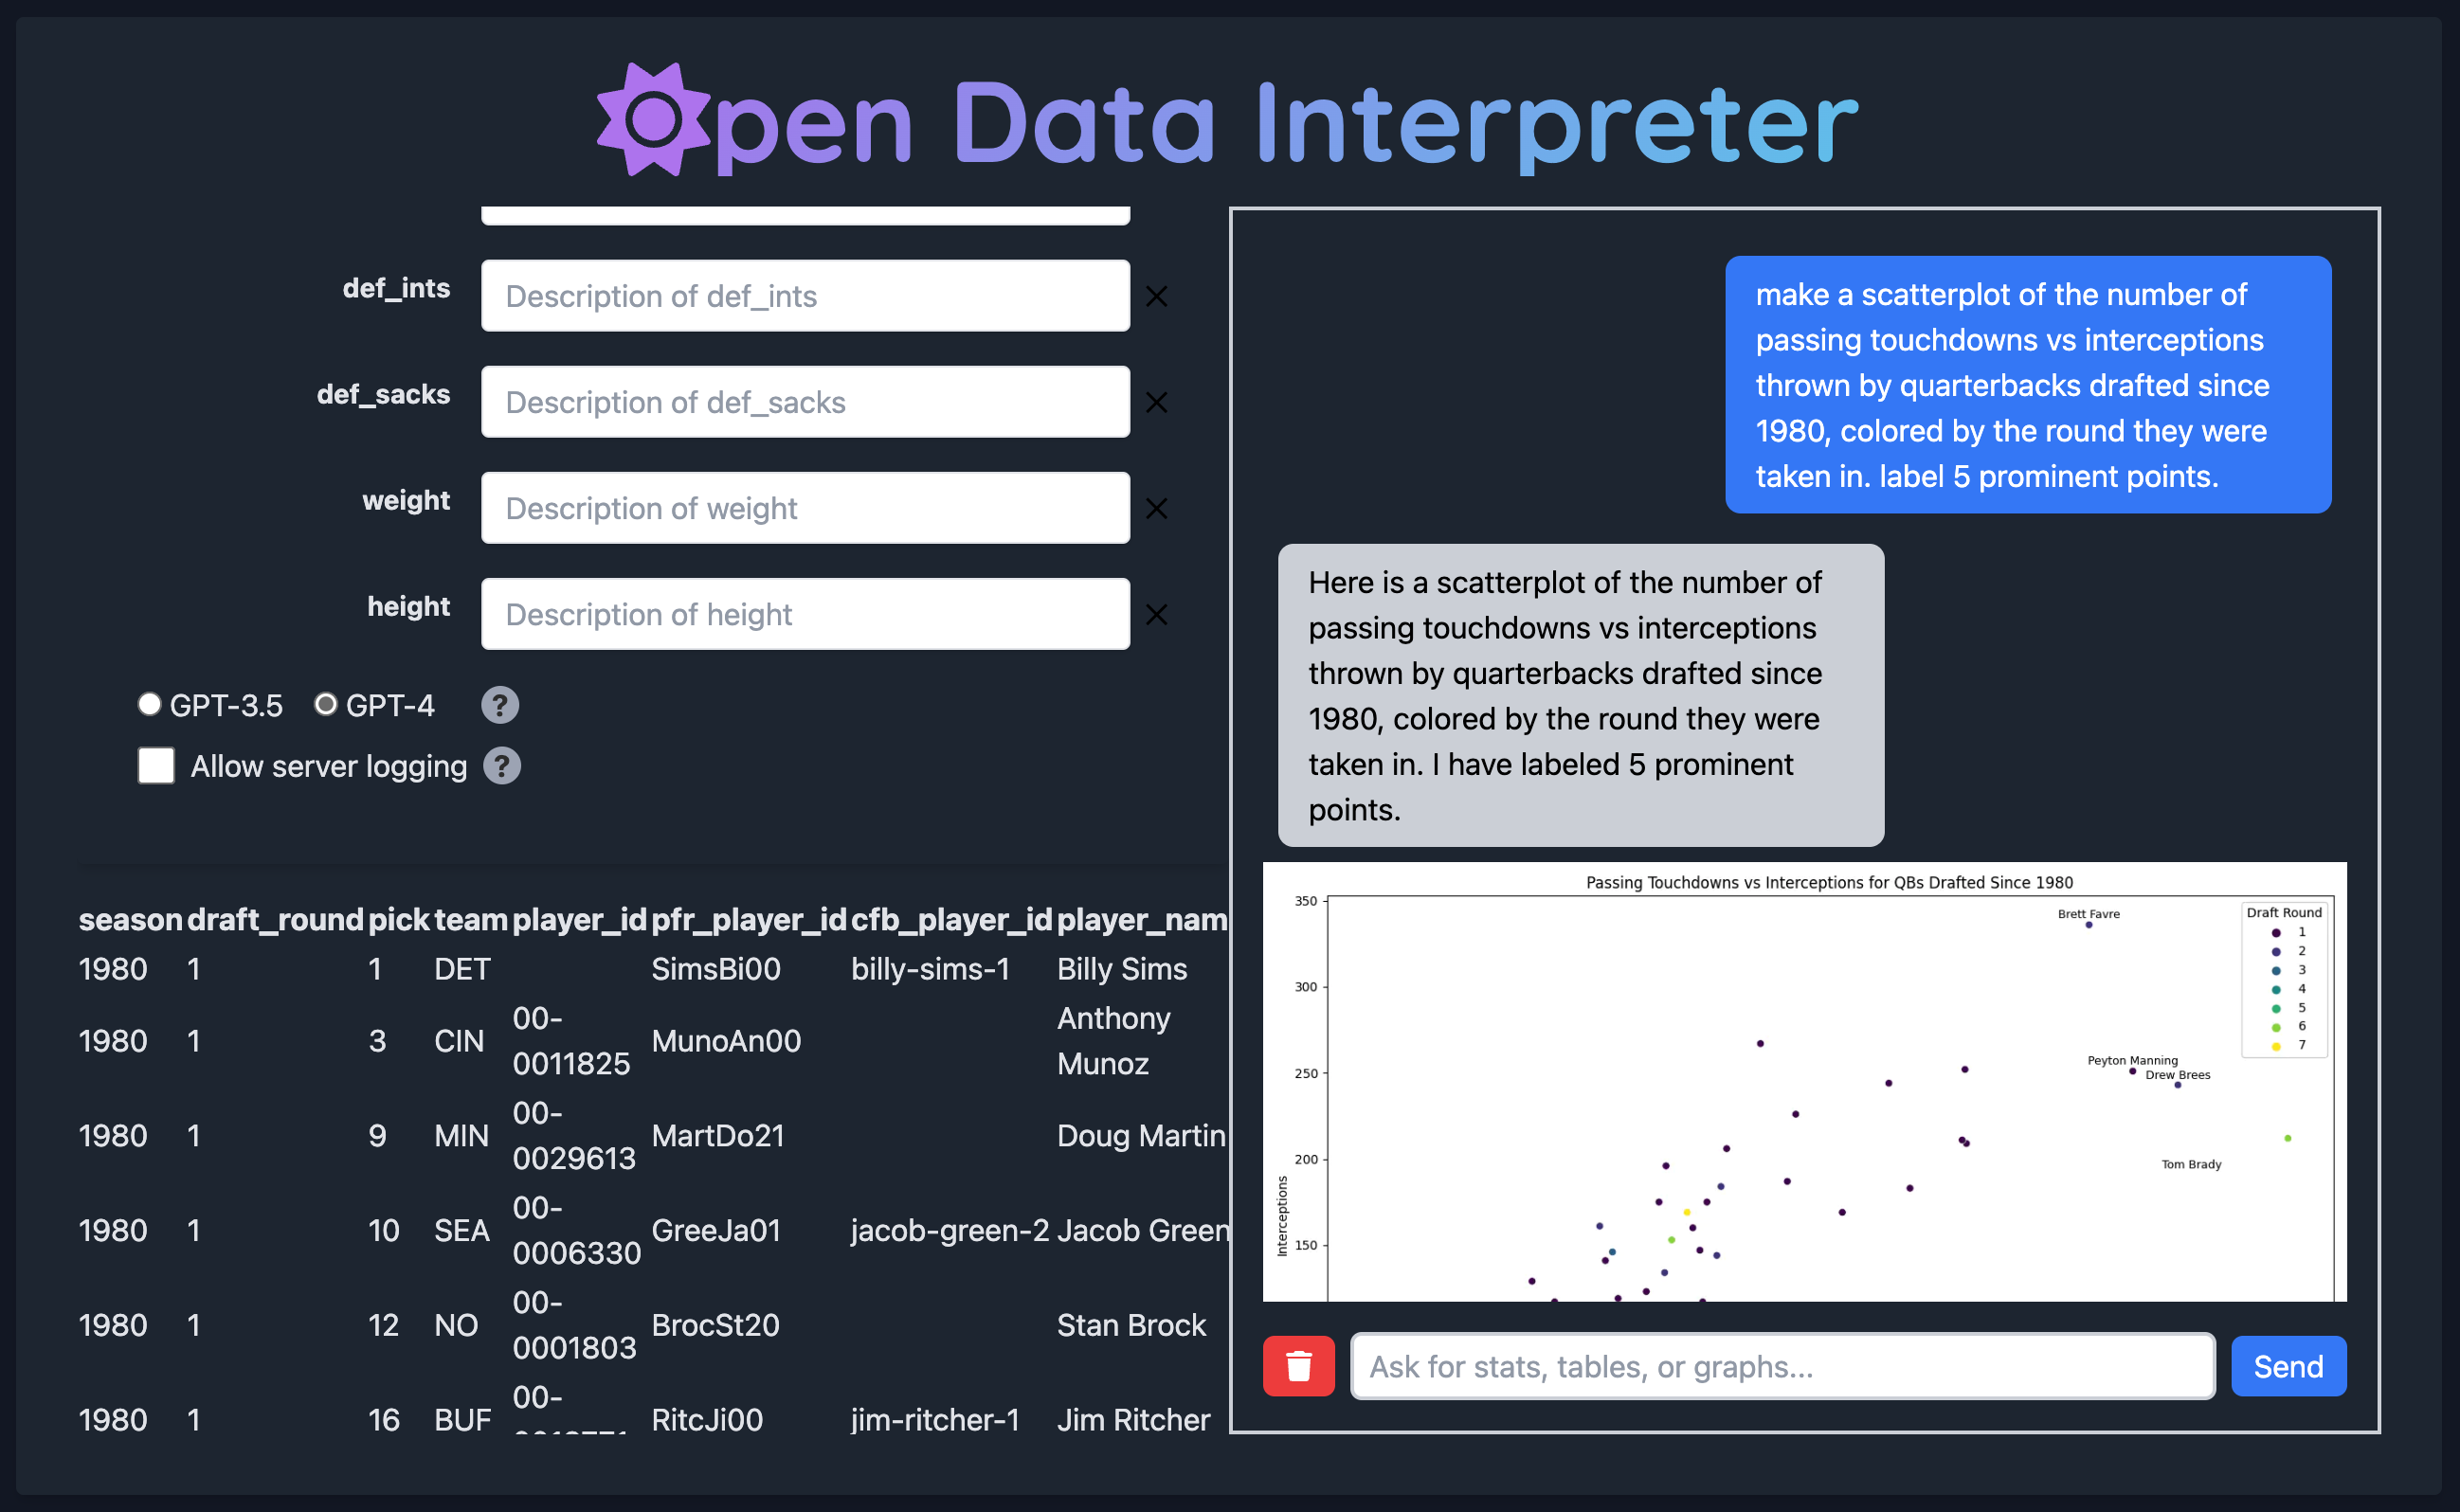
Video walkthrough of the Open Data Interpreter interface.
Features and Limitations
Some of the features offered by OpenDI:
- Chat with your CSV files – generate stats, tables, and graphs with natural language queries
- Update 5/25/23: With SQL in-browser mode, your file never hits our server (just the column names)
- Describe the content of columns to steer it towards answering questions correctly
- Remove irrelevant/redundant columns to focus its efforts (and save on token count!)
- Opt-in query logging (we don’t store your data either way)
- Toggle between dark mode and light mode
Some limitations of its current implementation:
- Only supports CSV files
- One file at a time – this approach can work for multiple files (Blitz uses six), but we haven’t added this feature to OpenDI yet
- Works most reliably with clean data, though you can steer it to ignore NaNs or address known limitations of your data
- Since all questions are answered with code, you can’t ask it general information questions like “what is a correlation coefficient?”
How it works
We use LangChain and GPT-3.5/4 to digest users’ chat history into a standalone question and map it to code to answer the question and generate appropriate tables/graphs as needed. We request a structured response containing three things:
- CODE: Code to run
- OUT_VARIABLE: The name of a variable in the namespace that will contain the response to return to the user after running the generated code
- IMG_PATHS: A list of filenames representing graphs generated by the code
Below is output for the question "create a scatterplot of the men's weights in september vs april," asked about this CSV file.
CODE: male_weights = df[df['Sex'] == 'M'][['Weight_Sep', 'Weight_Apr']
plt.figure(figsize=(10, 6))
sns.scatterplot(x='Weight_Sep', y='Weight_Apr', data=male_weights)
plt.title('Scatterplot of Male Weights in September and April')
plt.xlabel('Weight in September')
plt.ylabel('Weight in April')
img_path = 'male_weights_scatterplot.png'
plt.savefig(img_path)
out_variable = "Here is the scatterplot of weights of men in September and April."
OUT_VARIABLE: out_variable
IMG_PATHS: ['male_weights_scatterplot.png']
We then run the code in a constrained environment (allowing NumPy, Pandas, etc. but blocking the use of os, sys, exec, etc.). The specified output variable is used to return a textual response to the user, and the given image files are uploaded to Freeimage.host, a free image-hosting service. This output is then displayed to the user.
Roadmap
A couple features we want to get around to adding:
- With SQL.js, Plotly, and LangChain’s JavaScript API, it should be possible to achieve this in-browser without sending your data to a remote server (other than the first few rows sent to the LLM provider). Some initial code towards this is in the
in-browserbranch of the GitHub repository. Update 5/25/23: The SQL option is live, speedy, and works well with GPT-3.5. - When you refresh the page, the column descriptions disappear and can be cumbersome to re-enter. Being able to download/upload entered descriptions would make this process easier.
Acknowledgement
Thanks to Chroma for supporting the development of this project through the Hacker-in-Residence program, which Suvansh joined last week as an inaugural member along with Peter and Justin.
See More Posts

brilliantly Blog
Stay connected and hear about what we're up to!